Capture the observations
Gather information from worksheets, market feeds, and recurring snapshots.
Data analysis & visualization
See how separate customer records become a useful information source, how operating constraints shape a delivery plan, and how changing data becomes a repeatable report. Client work, fictional demonstrations, and SOLLUS research projects are identified below.
Start here · Client engagement
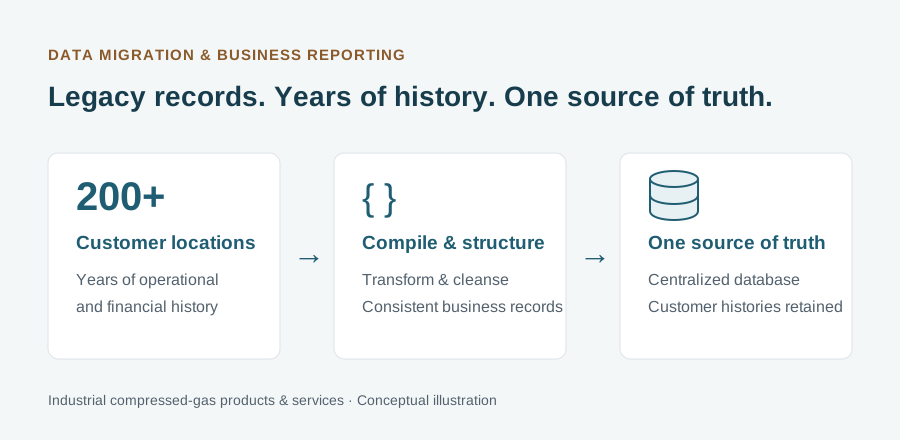
The engagement supported 200+ customer locations across multiple clients. SOLLUS compiled, cleansed, and structured legacy operational and financial information for centralized reporting within a larger modernization initiative.
The business result: an organized foundation for reviewing customer history and preparing reports. Mock screenshots explain the work without displaying client records.
See the migration story →The approach
The work behind these projects includes collecting information, checking its quality, organizing it for comparison, and presenting it in a form people can use again.
Gather information from worksheets, market feeds, and recurring snapshots.
Preserve timestamps, source information, and a consistent structure.
Compare conditions, apply screening rules, and investigate changes.
Bring findings into dashboards, charts, and repeatable reports.
Selected projects
Explore an industrial client engagement, a fictional distribution demonstration, and SOLLUS financial-market research. Together, they show data consolidation, operational modeling, validation, analysis, and automated reporting.
Client engagement / Industrial business data
Compiling, cleansing, and structuring legacy operational and financial information in an engagement supporting 200+ locations across multiple clients.
Explore the migration case study →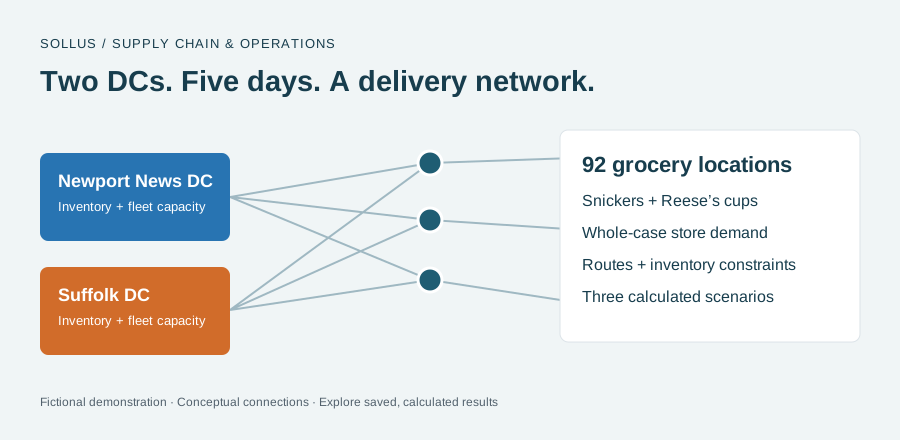
Supply chain & operational optimization
Compare three calculated supply, demand, and fleet scenarios. Inspect delivery routes, case quantities, DC inventory, and modeled cost across a five-day window.
Explore the supply chain case study →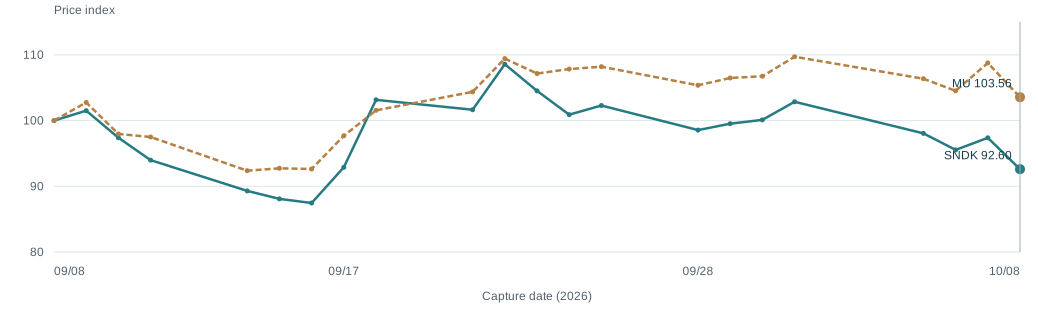
SOLLUS research / Capture & validation
Collecting detailed observations and preserving history for comparison. Explore the IBKR foundation and an actual SNDK and MU database example.
Explore the data foundation →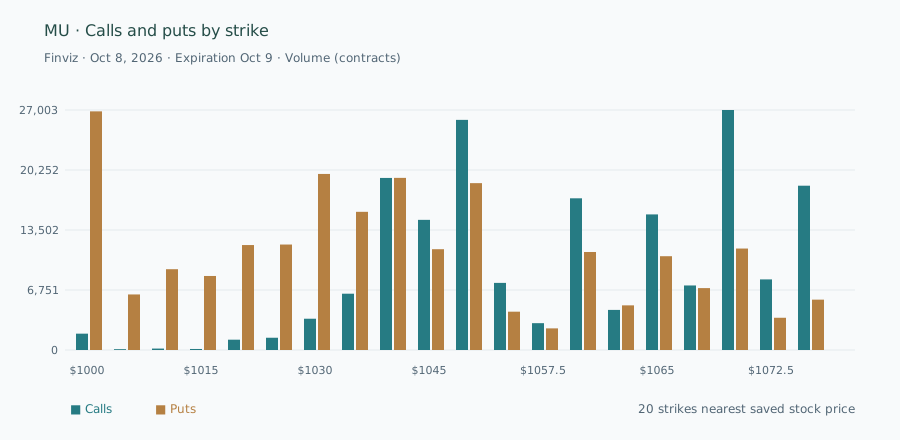
SOLLUS research / Exploration & visualization
Explore volume and open interest by strike, compare two capture dates, and inspect the underlying contract values.
Explore the options dashboard →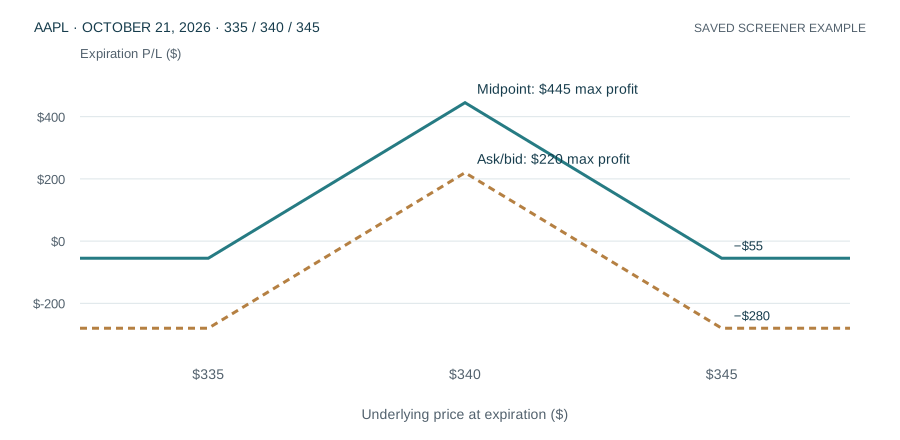
Screening & reporting / SOLLUS projects
Compare butterfly candidates interactively and explore an automated Excel report built from saved market observations.
Explore research & reporting →Business connections
The industrial migration case study brings years of customer operational and financial history together in one source of truth. The market examples demonstrate additional ways to preserve history, explore changes, and produce reports. A business engagement starts with your data and your process.
Bring scattered records together to compare trends, understand changes, and investigate differences across products or locations.
Model inventory allocation, delivery routes, capacity, and operating scenarios around your business constraints. Compare feasible alternatives and understand resource and cost tradeoffs.
Track conditions over time and build views that help teams identify exceptions and decide what needs attention.
Replace repeated collection and preparation steps with a consistent workflow and clear, reviewable outputs.
Put your data to work
Talk with SOLLUS about a supply chain decision, an operational constraint, a dataset, or a recurring process that could benefit from modeling and clearer analysis.